A Wood for Trees insight on mince pies this Christmas
Back to Blog
Written by Wood for Trees Analyst, Kayleigh Philps
Whether you love them, hate them or fall somewhere in between, this 13th century sweet treat has once again re-entered many of our lives this Christmas. The office and homes of the Wood for Trees bunch are no exception. And to add a little more (scientific) Christmas cheer this year, we’ve been true to our analytical nature by investigating the question; which is the best mince pie?
In our never-ending quest to uncover the greatest data secrets and insights, we’ve expanded our charity knowledge to that of the humble mince pie. Throughout December we’ve pushed the boundaries of our understanding of the seasonal treat through tasting and rating and aimed to better understand which is our favourite! That’s right, we’ve crunched the numbers, so you don’t have to.
We all know the three Cs behind a good, scientifically valid experiment: control, control and control. It’s with these in mind we crafted the methodology to ensure all results gathered were valid and robust.
Procedure:
1. Resource gathering (buy/make mince pies, as many and varied as possible)
2. Data collection (eat said pies, as many and varied as each participant could manage)
3. Data recording (pie KPIs recorded in a spreadsheet format: overall score, appearance, aroma, taste and any comments. Pie specific measures included price, weight and number per pack)
4. Insight formation (creation of tasty visuals)
Additional rules if you want to play along at home:
1. Know your measures – everyone knows the key KPIs for a good pie are appearance, aroma and taste, but feel free to branch out into other measures where you see fit
2. Consistency is key – don’t be afraid to rate the same type of pie twice, thrice or even more times. This additional data collection allows for insights of consistency to be made
3. Be wary of free text fields – certain individuals (who shall remain nameless) loved pies so much they wrote a little essay!
Tasty insights
All the best insights are derived from solid KPIs. Appearance, aroma and taste are the rulers when it comes to measures of goodness for mince pies and engage three of the five senses. Touch and sound were deemed too cumbersome to measure (can you hear a pie?).
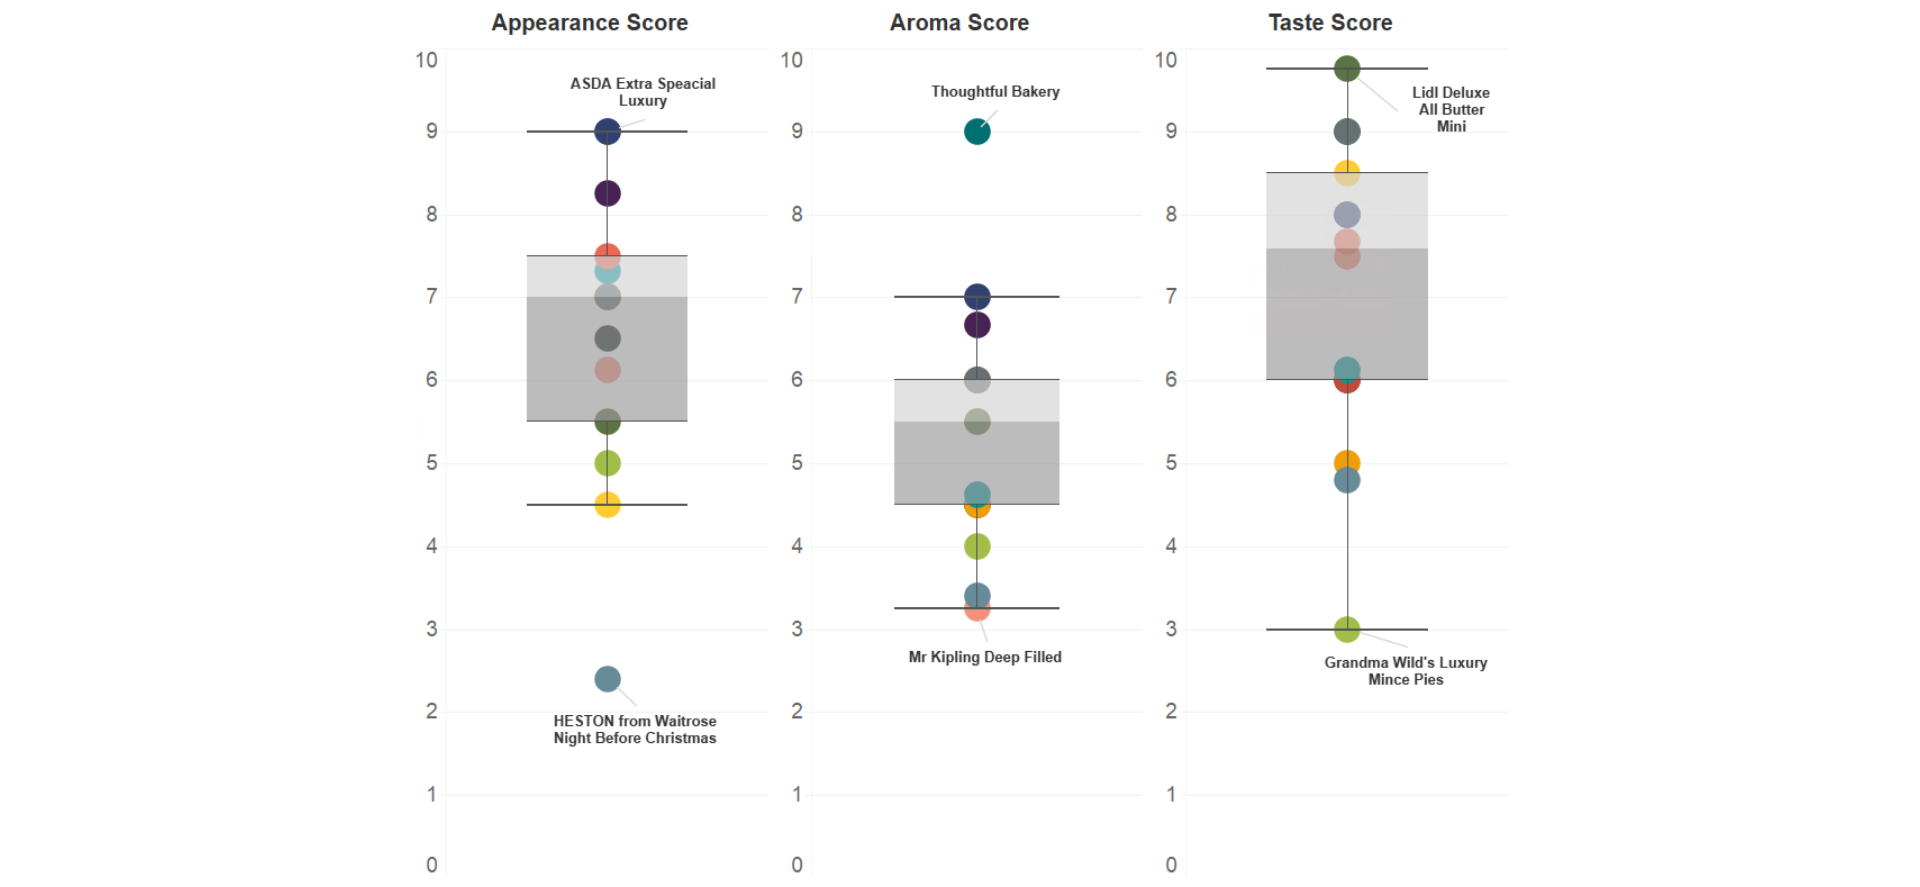
Topping the charts for appearance with an almost perfect 9/10 score was the ASDA Extra Special Luxury – we fell head over heels for the jazzy star design. Bottom of the leader board, and scoring lower than the interquartile range, came Heston from Waitrose due to its 14th century meat pie appearance, with comments such as “didn’t even look like a mince pie” and “not stand out appearance wise”. Apologies Heston, but I can’t mince(meat) my words, the unconventional nature was just too much for us.
The best engager of our olfactory sense was Thoughtful Bakery, scoring 9/10 for aroma (produced from a delicious bakery merely meters from our office at Trim Street, Bath) – likely due to the “boozy fruit centre”. With a score of 3.25/10 Mr Kipling may have exceedingly good cakes but apparently this doesn’t extend to the aroma of his pies.
Perhaps most importantly, the winner of the taste category was Lidl’s Deluxe All Butter Mini with a scrumptious 9.75/10 – the highest of any score awarded! Sadly, Grandma Wild was let down by having “not much taste”, a harsh but fair score, especially if the recipe hasn’t changed since 1899.

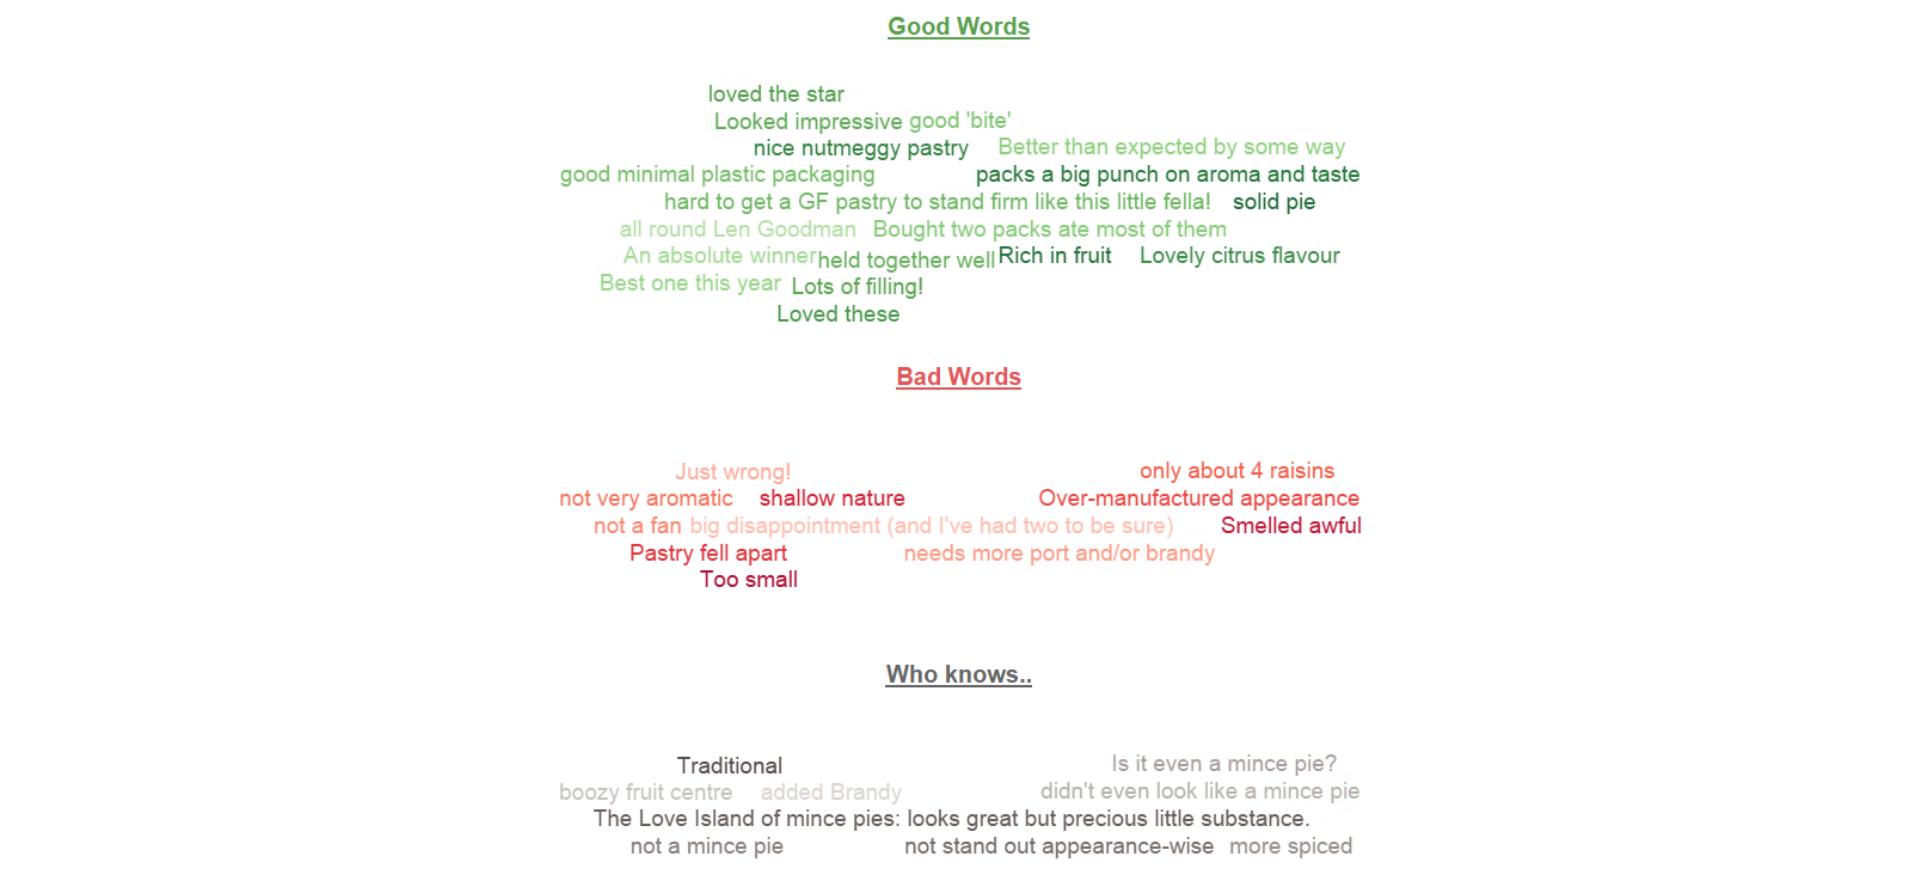
If you’re not a numbers person, or like me, just like to get into the nitty gritty detail, qualitative data is for you! Here are some of my personal favourite notes from the team (these are all genuine comments, even the Len Goodman and Love Island ones, seriously).
Text analysis generally is exciting and this is no exception. Themes and ideas around pies emerge when we cluster the sentiment (whether it’s positive or negative) together. Team Wood for Trees enjoyed the “solidness”, “filling” and “citrus flavour”. We disliked that some “needed more port and/or brandy” and were “too small”. And it became philosophical on the non-traditional/crumble topped pies in particular, with slightly passive aggressive comments such as “is it even a mince pie?”

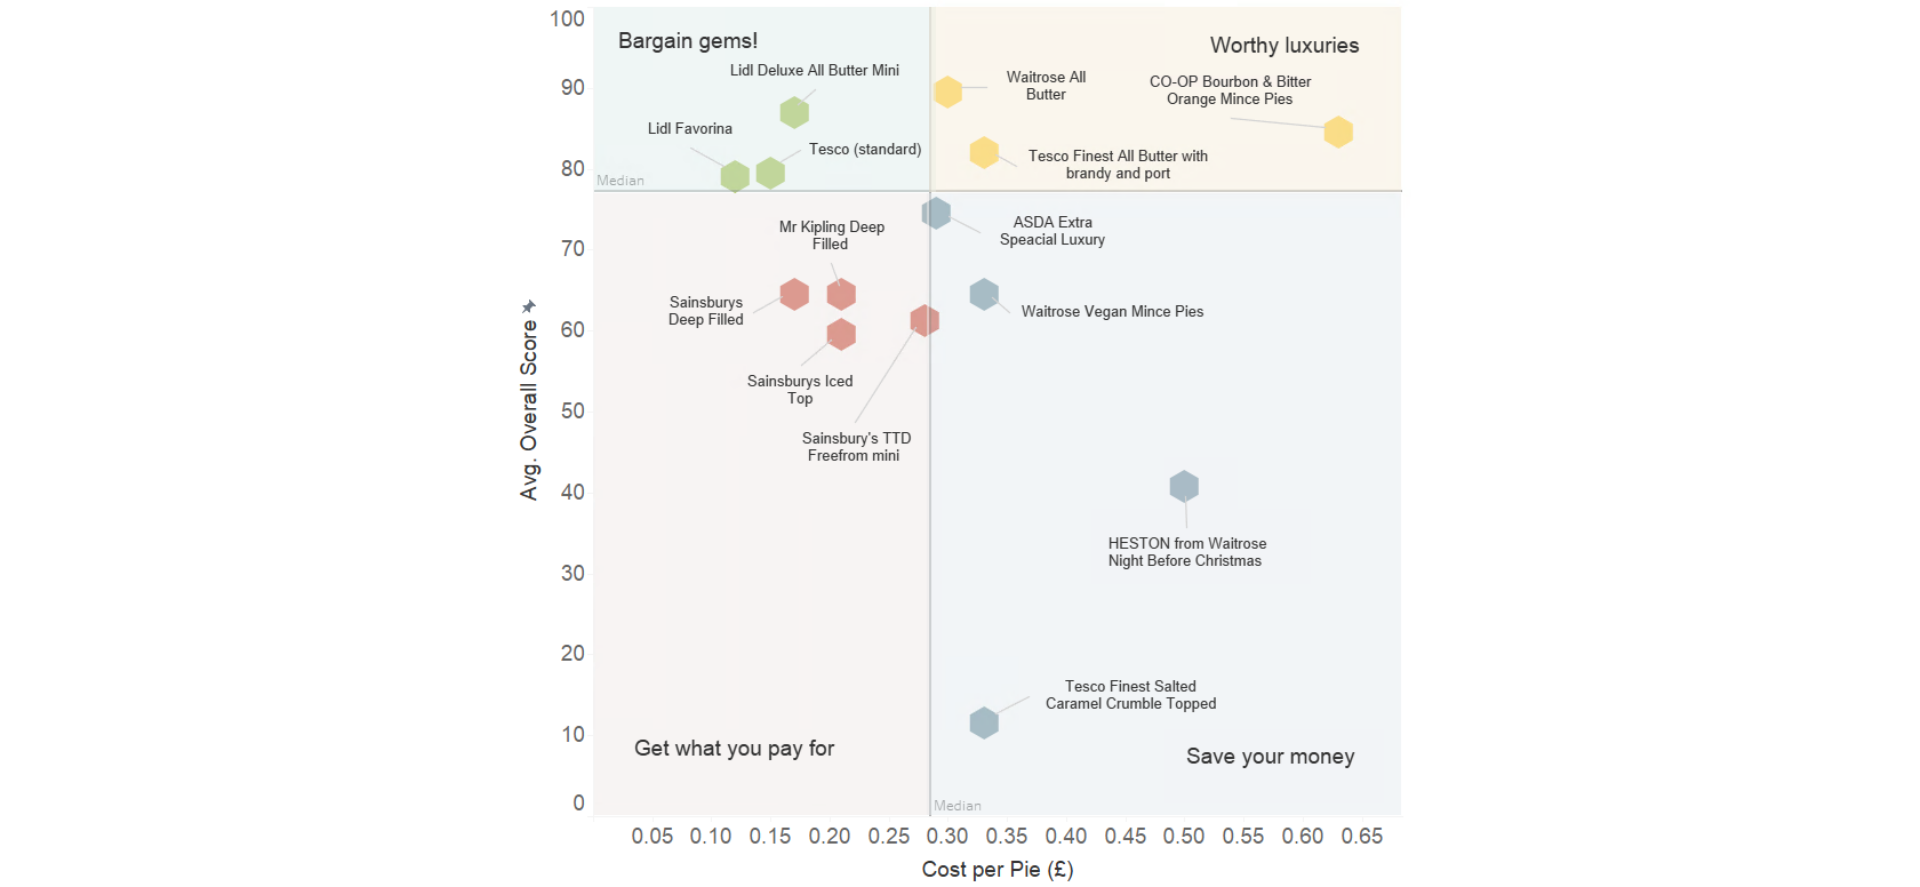
Truly insightful visuals describe to us what’s happening and allow us to make informed decisions about what to do next, we want a general measure of ‘goodness’ and (if you’re not much of a spendthrift like this author) want to get bang for our buck. Hence, we finish with the overall score (0-100) and cost per pie (British pounds sterling) quadrant.
Scattered throughout this plot are each of the rated pies, with quadrants created from the median of each measure. For the numbers geeks among us, there’s a very slight negative correlation but not statistically significant (P=0.58).
“Save your money” highlights pies with a higher than average cost and lower than average score. These include the Heston pie (50p per pie, 41 average score) and Tesco Finest Crumble Topped (33p per pie, 12 average score) – both below average for overall score and high on price. Eat with caution. It’s worth noting the Heston produced a wildly high standard deviation (measure of spread between scores), with a commendably highest high score of 80 and worrisome lowest low score of 0! One person’s treat is another’s waste of calories.
In contrast, Lidl is making itself known in the “bargain gems” section (low cost, high score) – they really do live up to their slogan when it comes to mince pies. Additionally, many Lidl varieties come in packs of 12, which is particularly good if, like this author, you live in a household of two.

Can we crown a single winner? Well, it’s true all pies aren’t made equal in the eyes of the Wood for Trees team and their invaluable KPIs, with some making themselves known for bad reasons, and others good. Of one thing we’re certain, this has been an extremely indulgent December.
